
Case studies · figures from Ahrefs and Google Ads
Numbers with the axis labels left on.
Client names are withheld. Everything else — sector, market, timeframe and figure — is exactly as it appears in the reporting. Including the account running at nearly £49 a conversion, because leaving that one out would make the rest less useful to you.
Outbound travel company, Sri Lanka
The result worth studying, because of what it took rather than what it produced. Forty-two keywords in the top three positions, earned from fifteen referring domains. That ratio is the whole argument against buying links in volume.

Organic traffic climbed from roughly 350 a month to about 1,200 across the year, and the line is a steady slope rather than a spike, which is what earned rankings look like. The domain rating stayed near zero the entire time. Authority metrics did not produce this result; matching pages to booking intent did.
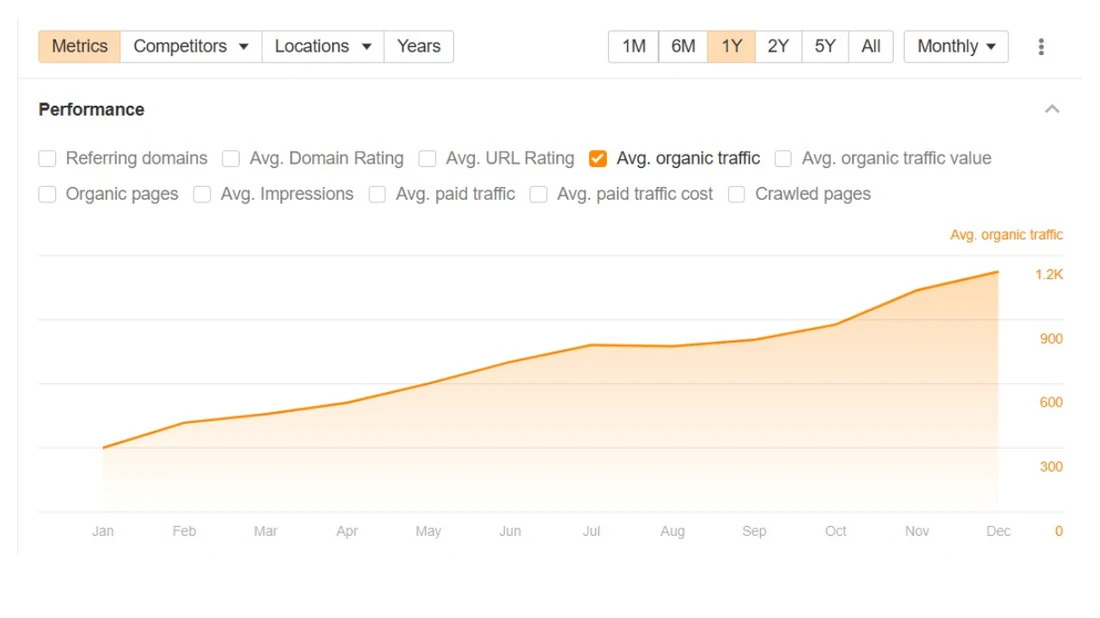
Thirty-one backlinks in total. Any agency selling a hundred links a month would call that a failed campaign. It produced forty more top-three positions than the site started with.
Travel company, United Kingdom
A larger, more competitive site in a market with far bigger budgets. Different problem, different shape of answer: here the work was breadth of coverage rather than concentrated top-three positions.

Nearly seven hundred additional keywords entering the rankings in six months, tracked across a set of 2,457 terms. A batch of those arrived new at positions one to five, many of them local-intent searches, which is the pattern you get when service and location pages are built properly rather than folded into one page.
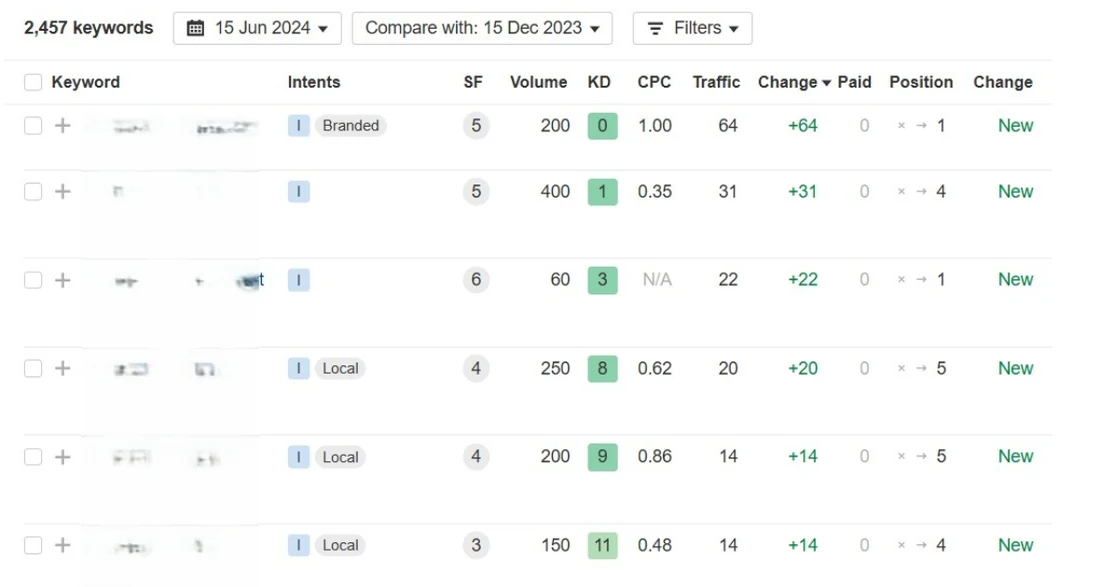
Worth noting what is not here: only six terms in the top three. In UK travel that is a long game, and pretending otherwise would be dishonest. The referring domain growth is what makes the next six months possible.
Google Ads reporting snapshots
Straight from the accounts. Two report in dollars and two in pounds because they run in different markets. Blank cells are metrics the snapshot did not show.
| Account | Period | Clicks | Conversions | Avg. CPC | Cost / conv. | Spend |
|---|---|---|---|---|---|---|
| Travel, USD | Sep 2023 | 9,330 | 618.7 | $2.24 | — | $20,900 |
| Travel, USD | Sep 2023 | 2,980 | 423.8 | — | $15.20 | $6,440 |
| UK, GBP | Sep 2023 | 9,370 | 267.9 | — | £48.69 | £13,000 |
| UK, GBP | Jul–Oct 2025 | 1,110 | 72.0 | £1.29 | £19.82 | — |
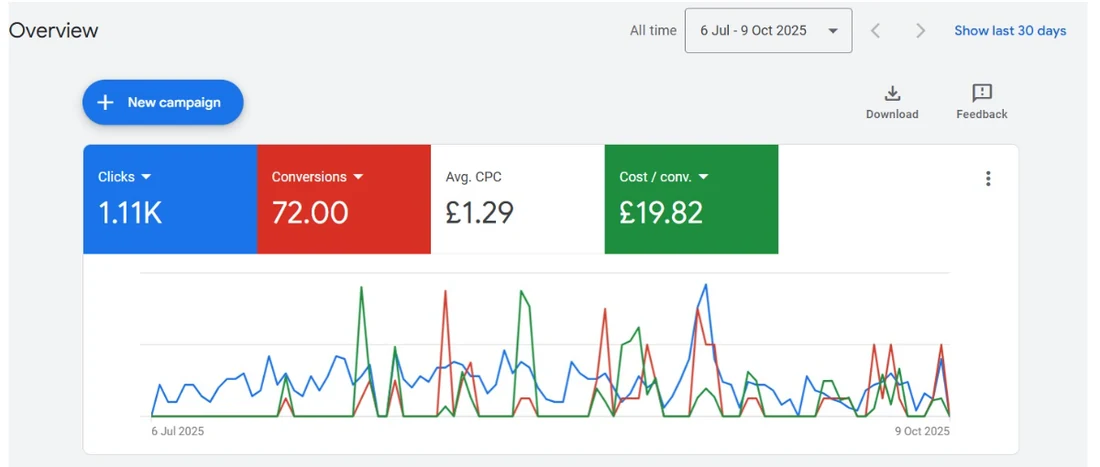
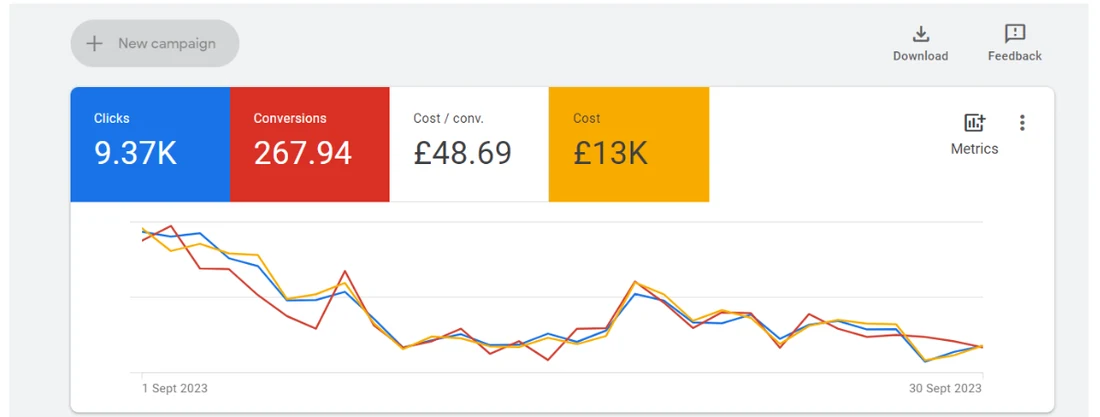
The spread is the point. Four accounts run by the same person with the same method, and cost per conversion ranges from £19.82 to £48.69. Anyone quoting you a cost per lead before looking at your account is guessing.
The last row is the most useful one for most Sri Lankan businesses. A little over eleven hundred clicks across three months produced seventy-two conversions at under twenty pounds each. That is what a modest, carefully managed budget looks like — not the six-figure case studies agencies tend to lead with.
What these have in common
Conversion tracking was fixed before anything else in every one of these accounts. Without it the reported numbers above would be fiction, and the optimisation decisions that produced them would have been made against the wrong signal.
None of them used bought links, private blog networks or directory packages. The Sri Lankan case reached forty-two top-three positions on thirty-one backlinks in total.
And in each case the paid and organic sides informed each other. Search terms that converted in Google Ads within weeks became the content priority for SEO, which removes most of the guesswork that makes the first six months of an SEO engagement expensive.
Questions about these results
Why are the client names hidden?
Because most clients would rather competitors did not know who runs their search. Sector, market, timeframe and figures are all real and taken straight from Ahrefs and Google Ads reporting. If you want a reference, that can be arranged directly with a client's permission.
Are these results typical?
No, and nobody's are. Cost per conversion in particular swings enormously by sector and market — one account below runs at under £20 a conversion and another at nearly £49, both managed properly. What is consistent is the method, not the number.
Why show an account with only 72 conversions?
Because a small, recent account is more informative than four large ones. It shows what a modest budget actually buys, which is the question most Sri Lankan businesses are really asking.
Can I see more of the reporting?
The panels above are unedited apart from client identifiers. If you want to see live account data rather than screenshots, that can be done on a screen share, which is the only real answer to the fact that any screenshot can be faked.
See what your account looks like
The free audit produces the same kind of reporting for your own site or ad account, with the issues ranked by what will move first.
+94 71 640 8715
kasun@wirecabin.com
Mon–Fri, 08:30–22:00